The ES opened within the previous day’s upper distribution Thursday, chopping around in just a 3 1/2 point range for the opening 30 minute period. Price tried to rally in B period, looked above the previous day’s high but immediately reentered the previous range. There was no price acceptance above the prior high.
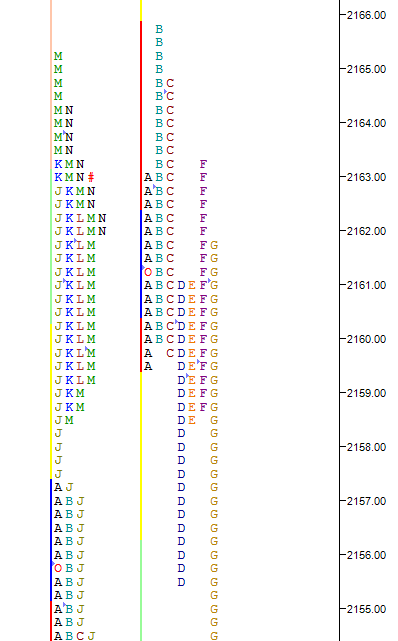
Trading was very mechanical early, including the selling from a tick below the opening print in D period leading to an initial test of Wednesday’s lower distribution. Price was rejected on that attempt and rallied back into the upper distribution above 2158, but failed at the 2163 previous close . The rout was on…
The market broke in G period, reentering Wednesday’s lower distribution for a second time, accelerating lower through the entire distribution and taking out the prior low at 2144 before finding a bottom at 2137.25, 28 points off its high. The selloff started from just one tick above the previous day’s close, a very visual, mechanical level for short term and day timeframe traders.
Thursday’s value area, which had developed higher for the first half of the trading session, ended the day overlapping to lower. After forming a second, lower distribution, the point of control also dropped lower from an earlier 2161 to close the session at 2148.75.
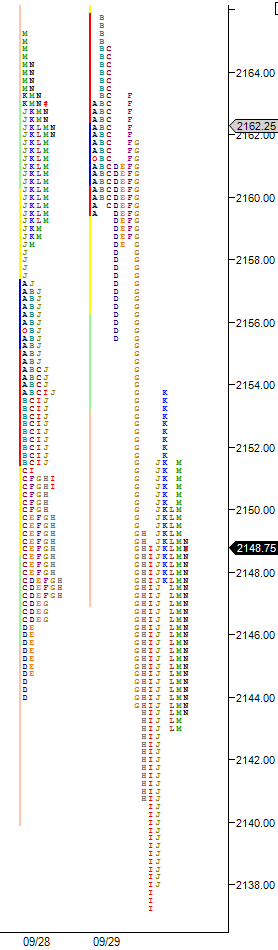
Double Distribution
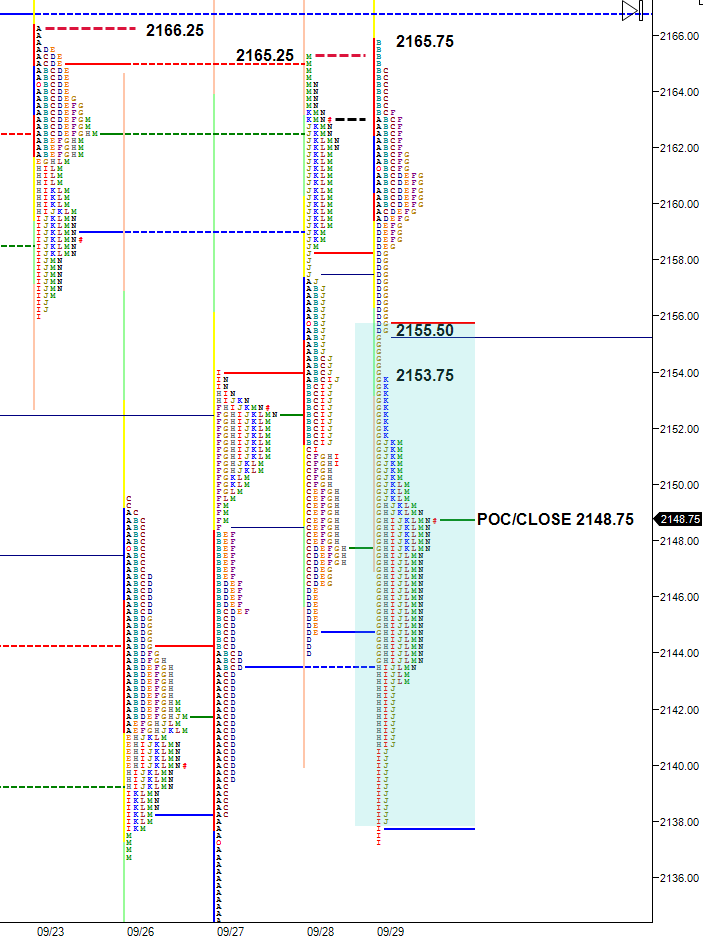
The 2153.75 late rally high in K period and single print at 2155.25, separating the two distributions, could be early trading references for Friday’s pit session. Each distribution can be viewed as a separate balance, with market profile balance rules applying – look above or below balance and accelerate, look above or below and fail and return within balance targeting the opposite side, or remain within balance.
If price exits one balance area and is accepted into another, the opposite end of that balance is the potential destination.
ES Daily Chart 9/29/16:
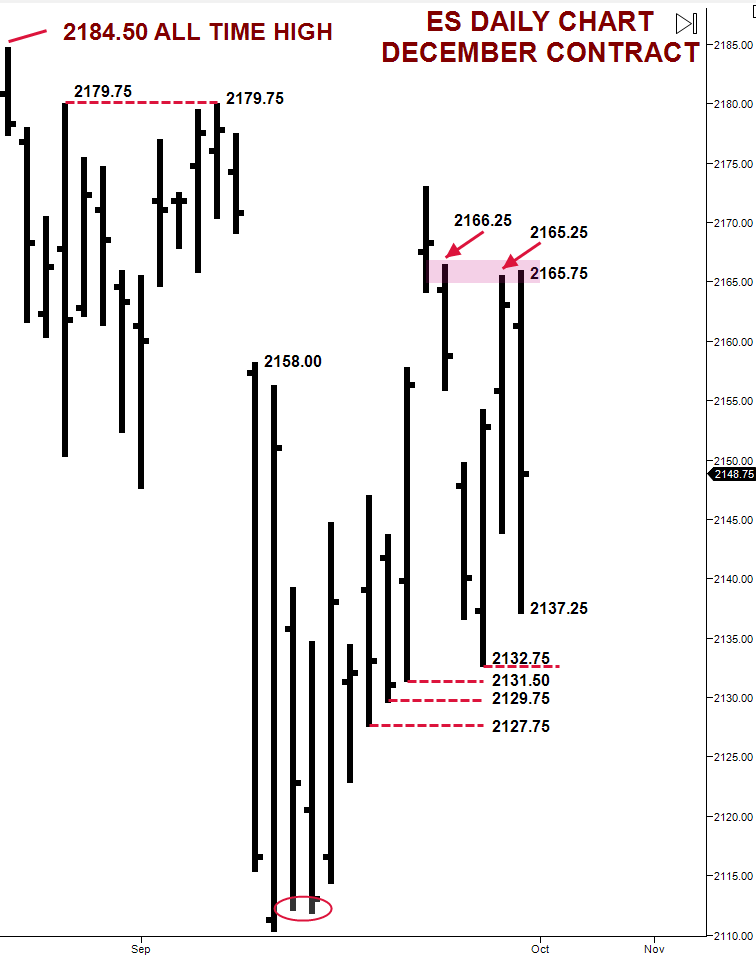
There are now three daily highs from 9/23, 9/28 and 9/29 all within 4 ticks of one another. Exacting areas like these could suggest liquidation from short term traders rather than new money selling the market. Also, the market closed back within Wednesday’s range at 2148.75 and did not get outside day.
Below Thursday’s low at 2137.25, and more importantly the selling tail low from 9/27 at 2132.75, are a series of similar lows within two points of each other. If there are still many longer timeframe stops below those levels, selling into them could potentially set off a “firecracker effect”, where hitting one set of stops could set off another, driving price lower.
(the above post and every post on es-traders.com is an interpretation of market generated information using the Market Profile, and the information contained within is to be used for informational purposes only and not to be construed as investment or trading advice. Please read our disclaimer)

Subscribe: