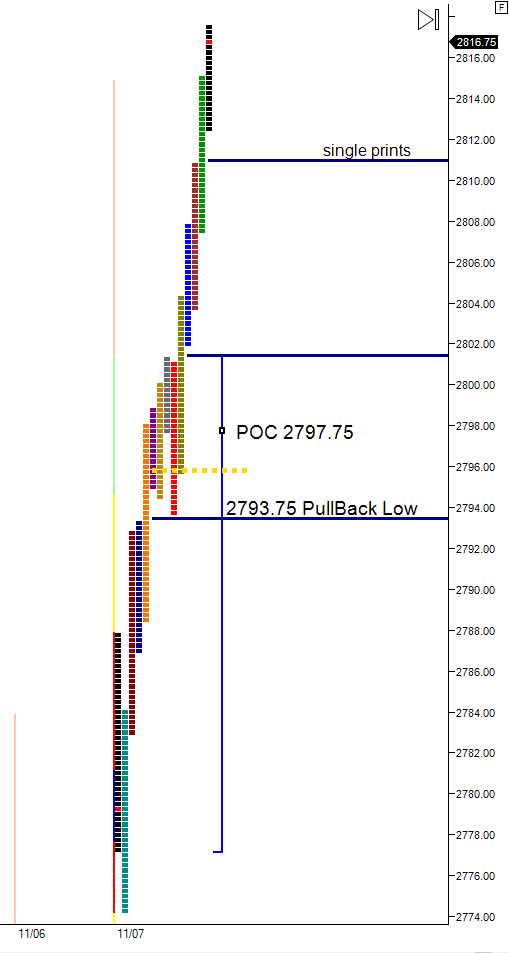
Trend day higher after large gap opening higher ahead of Thursday’s FOMC Meeting. Price one time framed higher in all but two periods.
Profile charts with multiple anomalies are often at least partially filled in on the next trading day. The near matching daily highs at 2819.00/2819.25 from 10/16, 10/17 could be a target if price tests above Wednesday’s high.

Subscribe: