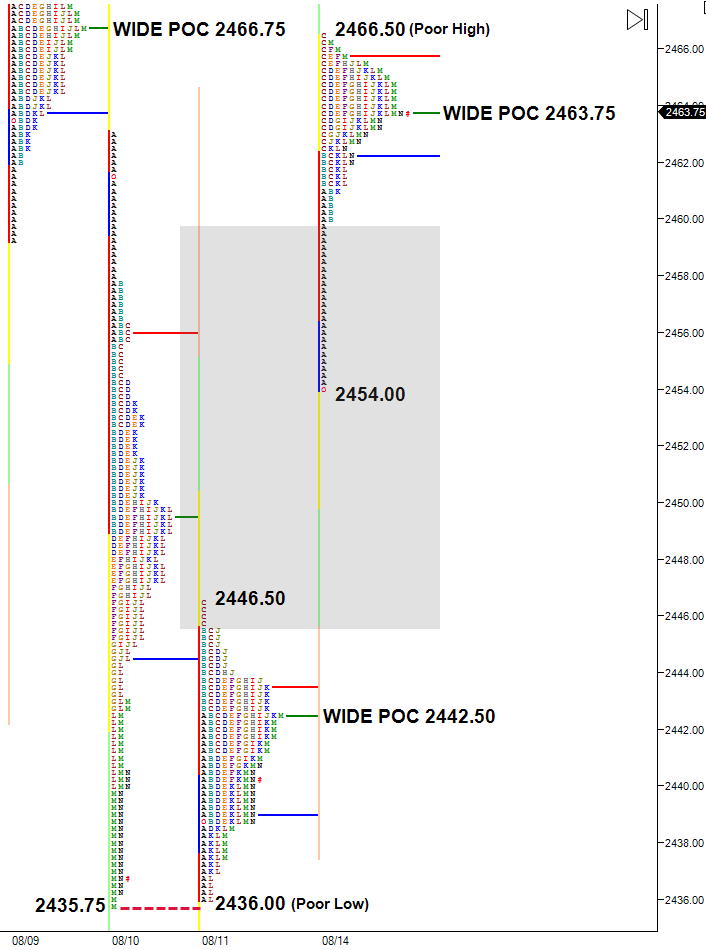
After leaving a poor and weak low (no excess and exactly at the prior day’s low) on Friday’s 10.5 point balanced regular session profile, the ES gapped open higher on Monday on seemingly high confidence, but not very high volume (first half hour NYSE volume was just at 317,798).
Ignoring the 100% short overnight trade leading into the open (no correction) the market rallied/*short covered from the opening bell, leaving a long string of excess single prints in the opening period.
Excessive single prints in a single 30 minute period are often at least partially filled in on the day they’re created, or soon after. Monday’s second period (B) could only trade 5 ticks into the A period single prints, leaving 24 ticks of excess. Single prints, along with gaps, are a form of excess.
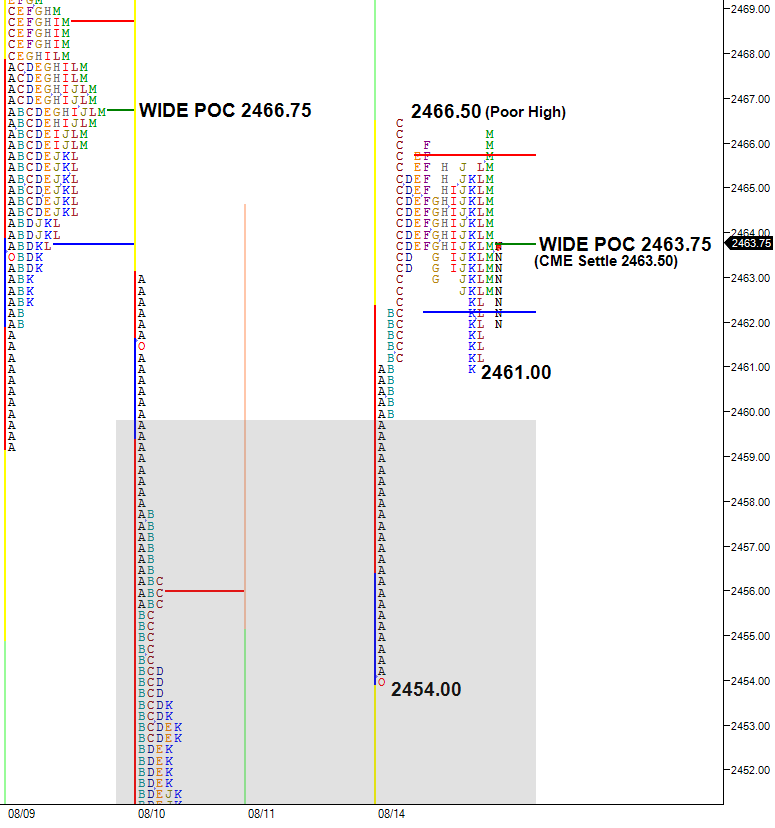
After rallying higher to just a single tick below the very wide point of control from 8/9 at 2466.50 in C period, the market balanced in less than a 4 point trading range until a minor liquidation break in K period failed at the A period high and single print at 2461.00.
The high or low of the day is often made in the first 90 minutes of trading. After the early short covering ran its course, and with no new apparent longer term money buying (as evident by lower volume), the high of C period at the wide POC marked the high of the day
It appeared that short term traders were back to buying off mechanical levels – G/I/J/M lows were all within one tick of Thursday’s (8/10) selloff high, the K period low was exactly at the A period high and single print, and the L period low was a single tick off the K low.
Monday’s rally put price back into the multi day trading range above 2457.00, and after closing as an outside week on Friday, back near the center of the prior week’s range.
It is not uncommon for a new trading range to develop following a large gap higher to begin the week, as large gaps are rarely filled on the day or day after they’re created.
Monday’s profile left a poor high at 2466.50 and another very wide point of control at 2463.75. Depending on where price opens Tuesday, balance trading scenarios relating to Monday’s upper balance between the K period pullback low at 2461.00 and the day’s high at 2466.50, could apply:
– Look above and repair the poor high at 2466.50 and accelerate/ continue higher. The excess prints at the 8/9 high and multiple anomalies from the 8/8 profile are potential targets.
– Look above and repair the poor high at 2466.50 and fail, returning back into Monday’s upper balance area and targeting the very wide point of control at 2463.75. Acceptance below the K period pullback low at 2461.00 targets the excess single prints and potentially the lower gap.
– Look below Monday’s K period pulback low at 2461.00 and accelerate, targeting the excess single prints and lower gap.
– Look below Monday’s K period pulback low at 2461.00 and fail, returning back into Monday’s upper balance targeting the wide point of control and poor high.
*Total NYSE volume for Monday was very low at under 2.7 billion shares, also suggesting Monday’s trade was mainly short covering.
(the above, post and all posts on es-traders.com, is an interpretation of market generated information using the Market Profile, and the information contained within is to be used for informational purposes only and not to be construed as investment or trading advice. DO NOT BASE ANY INVESTMENT DECISION UPON ANY MATERIALS FOUND ON THIS WEBSITE. We are not registered as a securities broker-dealer or an investment adviser either with the U.S. Securities and Exchange Commission (the “SEC”) or with any state securities regulatory authority. We are neither licensed nor qualified to provide investment advice. Please read our disclaimer)
Subscribe: