After a no-vote on the repeal of ObamaCare in the US House of Representatives on Friday the ES stayed in its 2 1/2 day trading range, just briefly looking below it late before short covering into the close
Split-view Market Profile charts on March 23rd and 24th:
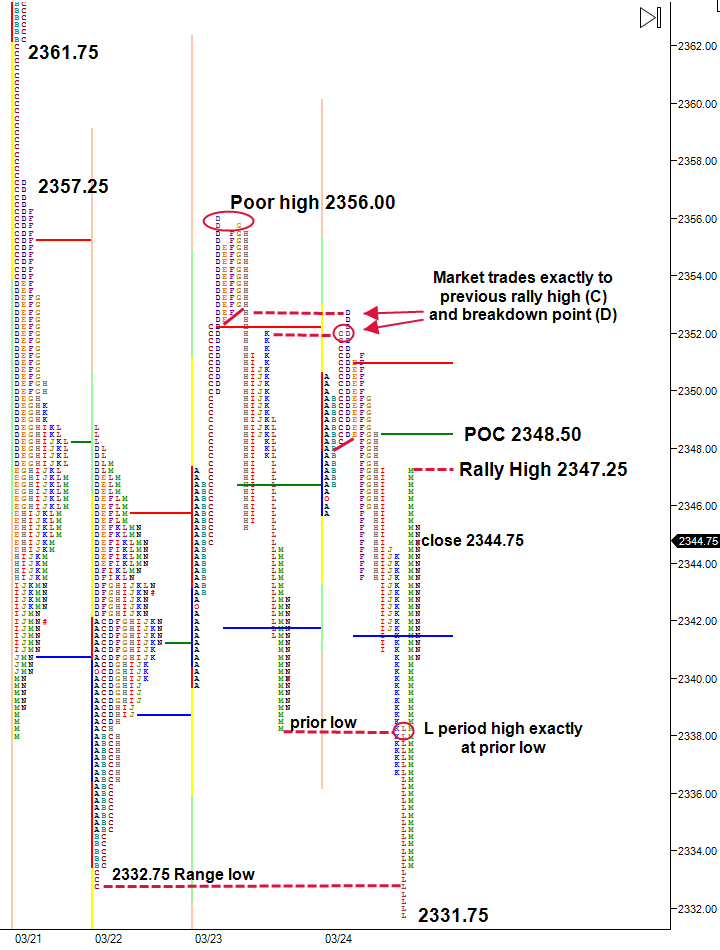
The ES opened near the center of the recent trading range and traded at a sluggish pace early as traders still waited for the House to vote on the repeal of ObamaCare and replacement with TrumpCare. Price grinded higher exactly to Thursday’s rally high at 2352.00 in C period, trading a few ticks above it in D period to the level the market broke down from on Thursday.
A sharp spike lower in F period ran the stops below the near matching C/D/E lows, but with no continuation the market bounced back to the developing 6 TPO wide point of control at 2348.50, widening to 8 TPO’s by H period.
After trading lower in I and J, the market broke sharply again in K and L periods, looking below the prior day’s low at 2338.25. But with the combination of low volume (NYSE daily volume was under 2.98 billion), slowing pace, a weak L period high and a wide point of control above price failed to break out of the range and continue lower, and quickly short covered in the final 30 minute trading period almost all the way back to the magnetic point of control.
Depending on where price opens on Monday, Friday’s late rally high at 2347.25 could be an important early trading reference. Opening below and not violating the rally high could infer the late rally was just short covering and Friday’s prevailing down trend is still in tact, increasing the odds of a retest of the weekly low at 2331.75. If a breakout to the downside occurs potential lower targets are the unfilled gap from February 10 at 2312.75 and the emotional 2300.00 price level.
Price acceptance above the rally high and wide point of control from Friday could easily see price test Friday’s high at 2352.75 and attempt to repair the poor high from Wednesday at 2356.00, and Tuesday’s lower distribution high at 2357.25. Higher references include the single print at 2361.75 and the long string of excess single prints above the anomaly at 2364.50.
(the above post and all posts on es-traders.com is an interpretation of market generated information using the Market Profile, and the information contained within is to be used for informational purposes only and not to be construed as investment or trading advice. Please read our disclaimer

Subscribe: