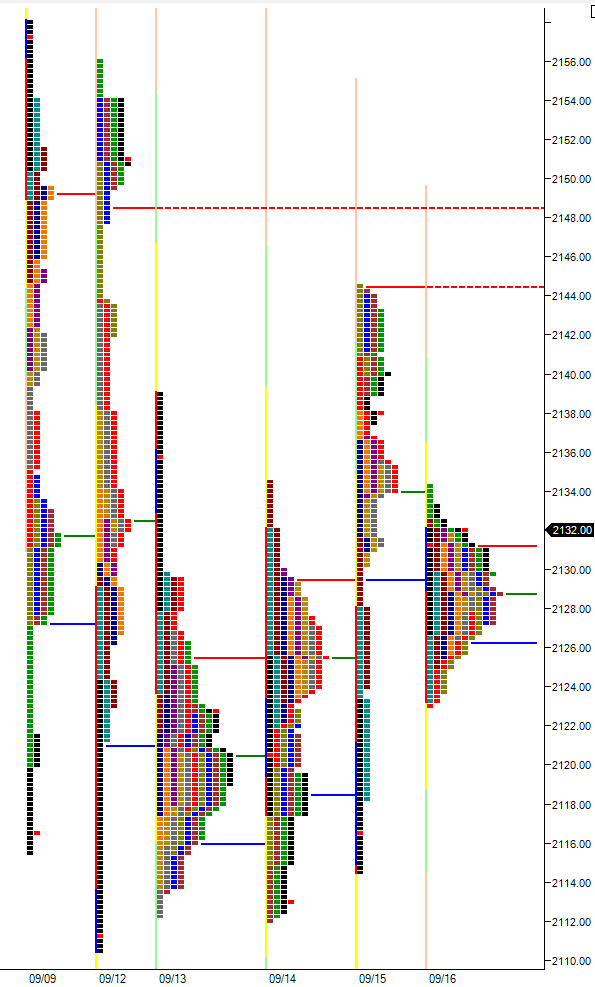
Market Profile chart Thursday, September 15, 2016

Opening within the previous day’s range, early pit session chop turned into a probable short covering rally Thursday.
With moderately low NYSE daily volume at only around 3.3 billion, the ES rallied through the previous two day’s highs, ending the session with a poor high and a stretched out profile littered with multiple anomalies. Poor market profile structure created from emotional short covering has good odds of being at least partially repaired in sessions soon after.
Friday is Quadruple Witching, which could create volatility in the markets. Therefore, normal market profile references are less reliable in markets that are highly volatile. That being noted, a potential early reference for Friday, if the ES opens within the upper half of Thursday’s range, is the G period pullback low at 2130.25. Failure to gain acceptance below that level could see price test Thursday’s close at 2138.00 and poor high at 2144.50.
The ES is currently trading in a range created from the September 9th* selloff. If the market continues the rally through Thursday’s poor high, price could test the single print and upper distribution from September 12th, followed by the back to back highs at 2156 and 2158. Above that could potentially target the lows from Sept. 2nd and 6th, and possibly even the GAP fill at 2175.75 from Sept. 8th.
But Thursday’s late buying almost exactly from the previous high in L and M periods suggests more mechanical buying and that short covering had possibly ended. If price is accepted below Thursday’s pullback low or if the market opens within the lower half of the prior range, Thursday’s single prints could come into play, and maybe a test of the weak/poor low at 2112 from Wednesday.
(the above post and every post on es-traders.com is an interpretation of market generated information using the Market Profile, and the information contained within is to be used for informational purposes only and not to be construed as investment or trading advice. Please read our disclaimer)
CORRECTION: The post stated: “If the market continues the rally through Thursday’s poor high, price could test the single print and upper distribution from September 12th, followed by the back to back highs at 2156 and 2158 (Sept. 8th & 9th)”
The correct dates of the 2156.00 and 2158.00 daily highs are September 12th and September 9th, respectively.
* The market is trading within the range of the September 9th selloff and September 12th low

Subscribe: