Four day balance at the latest all time high:
After the regular CME hours trading session for the ESZ7 contract closed on Friday, 9/15/2017, a late spike higher in the final 30 minute 4:30pm ET extended session took price above the day’s high at 2498.00 exactly to the 2500.00 level.
The Globex (overnight session) high and low are always important short term trading references coming into a regular trading session, the Globex high from late Friday being of especial significance because it made a new all time high outside of the CME regular trading hours. New all time highs that are made in an overnight session have high odds of being revisited in a regular hour trading session.
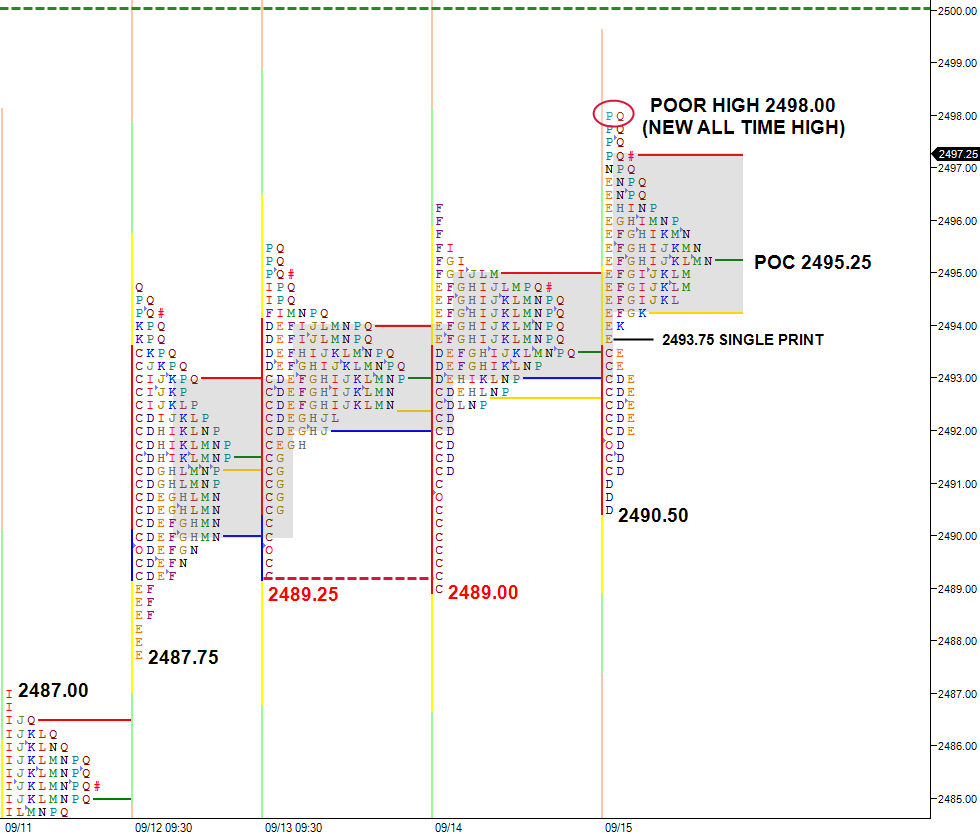
An obvious early, visual reference for Monday is the poor high at 2498.00, which was also a poor high with no TPO’s of excess.
Friday’s small 7.5 point trading range closed as a double distribution profile, with the single print separating the two distributions at 2493.75 at just one tick above the very prominent point of control from the prior day’s RTH profile.
Possible trading scenarios that could play out on Monday, depending on where price opens, are:
– Look above and repair the poor high at 2498.00, targeting the 2500.00 level, the obvious, very visual first target. Acceptance above that price could see 2500.00 used as short term support, and would be a breakout above the four day balance. The overnight high (unknown at the time of this posting) is the next visual reference. Overnight highs made in the overnight session have high odds of being revisited in a future regular trading session, although they can remain untested for long periods of time.
– Look above and repair the poor high at 2498.00, potentially testing 2500.00, but fail to find acceptance and return back into the four day balance. Failure to find acceptance above Friday’s high at 2498.00 questions the late probe to 2500.00, and should first target Friday’s prominent point of control at 2495.25, followed by the single print separating the two distributions from Friday at 2493.75.
Acceptance into Friday’s lower distribution could easily see a retest of Friday’s low, and attempt to repair the weak, matching lows from 9/13 and 9/14 at 2489.25/.00. If stops are hit and the potential “fireracker effect” ensues, the market could easily fill the gap from 9/11 at 2487.00. Liquidation/acceptance below that level and back into the 9/11 range targets the anomalies in the profile, and potentially the excess single prints below 2478.75.
Since that psychological 2500 level was not reached during the regular trading hours, and with apparently no world events important enough to cause any kind of volatility (the four day total point range was only 10.25 points), 2500.00 could be on the radar of short term and day time frame traders on Monday in the continued absence of larger time frame players, and barring any major outside news events. Will the market be accepted or rejected at 2500.00? “Game over, side out”, or can the rally higher continue.
The market has continued to one timeframe higher on the monthly chart since November, 2016, and all time frames appear to be trending higher again. The next FOMC meeting on Wednesday, September 20 should likely bring some volatility to this market. Trading below the four day balance low could be the first sign of a potential change, which is probably likely because of the poor profile structure below.
(the above, post and all posts on es-traders.com, is an interpretation of market generated information using the Market Profile, and the information contained within is to be used for informational purposes only and not to be construed as investment or trading advice. DO NOT BASE ANY INVESTMENT DECISION UPON ANY MATERIALS FOUND ON THIS WEBSITE. We are not registered as a securities broker-dealer or an investment adviser either with the U.S. Securities and Exchange Commission (the “SEC”) or with any state securities regulatory authority. We are neither licensed nor qualified to provide investment advice. Please read our disclaimer)

Subscribe: