ES weekly chart as of 8/9/17:
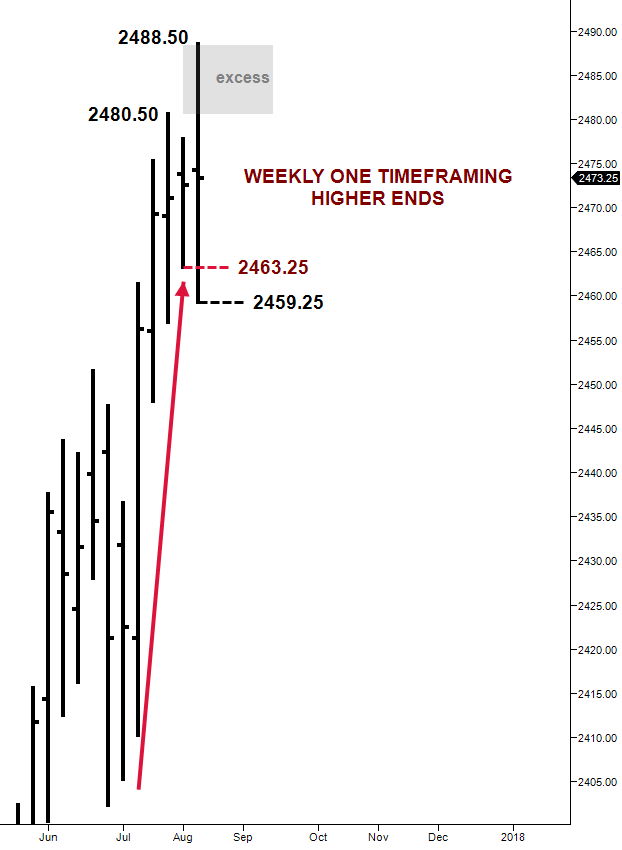
Although Tuesday’s ES selloff left substantial excess at the highs on the daily, weekly and monthly bar charts, and price had stopped one timeframing higher on the weekly chart, the market is still trading within an extended trading range from the July 27th profile’s excess low and (prior all time) high.

Trading is about change. Although the potential for change exists with the ending of weekly one timeframing, it is just one data point that could just be allowing inventory to return to short term balance after trading to the latest all time high at 2488.50. The market is still one timeframing higher on the monthly chart (currently in its 9th consecutive month), and would have to trade below the July low at 2405.25 (7/6) for that to end.
According to Market Profile Guru Jim Dalton, “Balance and excess are the two most important concepts you will be introduced to because they signify change or the potential for change to take place.”
On Wednesday, after a gap open lower following Tuesday’s selloff, price traded back down into the excess single prints near the July 27th low in the opening period, but failed to find acceptance or take out that low at 2457.00. Price spent the remainder of the day Wednesday in balance, before short covering back into Tuesday’s range and closing basically at unchanged (+ .25).
For any chance of meaningful change to occur to the downside in regards to the current multi day balance, price will have to remove the excess lows (7/27, 8/9) at the lower end of the extended range.
Wednesday’s profile left a very wide point of control at 2466.75. Depending on where price is at the open, that level could provide early support or resistance. Acceptance above the wide POC targets Wednesday’s near unchanged settle and high of day. Acceptance above the near back to back closes targets at least some of the remaining anomalies from the stretched out August 8th profile.
Trading below Wednesday’s low at 2459.25 targets the 2457.00 low from 7/27, acceptance below that level could put the market in a short term down trend.
(the above, post and all posts on es-traders.com, is an interpretation of market generated information using the Market Profile, and the information contained within is to be used for informational purposes only and not to be construed as investment or trading advice. DO NOT BASE ANY INVESTMENT DECISION UPON ANY MATERIALS FOUND ON THIS WEBSITE. We are not registered as a securities broker-dealer or an investment adviser either with the U.S. Securities and Exchange Commission (the “SEC”) or with any state securities regulatory authority. We are neither licensed nor qualified to provide investment advice. Please read our disclaimer)

Subscribe: