Market Profile balance trading rules applied on Thursday, where price looked above the prior two day balance and failed, reentering the range and continuing lower to the opposite end of the balance.
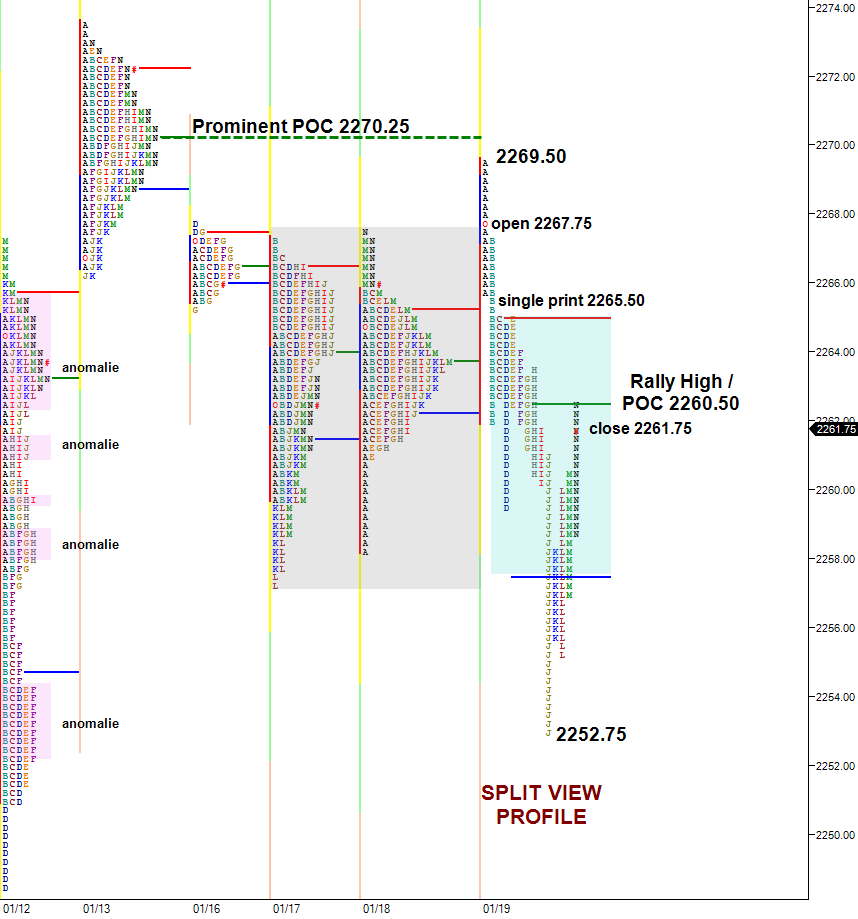
The market opened a tick above the previous day’s high and two day balance, trading to within a few ticks of the very prominent naked point of control from January 13th at 2270.25.
With a very slow pace and no directional confidence, price returned back into the two day balance. After chopping in less than a four point range in the opening period the market failed to trade above the prior day’s high in B period, then quickly traded lower through Wednesday’s very prominent point of control.
Failing to fill the single print at 2265.50, the C/D/E period bar highs traded within one tick of each other, a sign that mechanical short term traders are probably in control. When price trades that mechanically on average or below average volume it leaves good odds of that level being revisited, either later in the same session or possibly a session soon after.
A sharp break occurred in the J period bar, with price accelerating lower through the low of the two day balance. But with no continuation lower after the break, price reentered the prior range, trading to and closing just below the session’s point of control.
Depending on where price is at the open of Friday’s pit session, the late rally high and point of control at 2262.50 could be an early short term reference.
Often, a late rally high on a down day (or late pullback low on a trend day higher) could be a good gauge for any meaningful change relative to the previous day – if the rally high is not violated the the previous day’s trend could remain in tact.
Trading into Friday’s U.S. Presidential Inauguration, where President Elect Donald Trump will be sworn in as the 45th President of the United States of America, the short term trend is balanced. If price is accepted above 2262.50 the odds are good that at least the weak C/D/E bar highs and the single print at 2265.50 could be tested.
(the above post and all posts on es-traders.com is an interpretation of market generated information using the Market Profile, and the information contained within is to be used for informational purposes only and not to be construed as investment or trading advice. Please read our disclaimer

Subscribe: