S&P 500 emini futures Market Profile charts for October 11th (split view) and 12th, 2016::
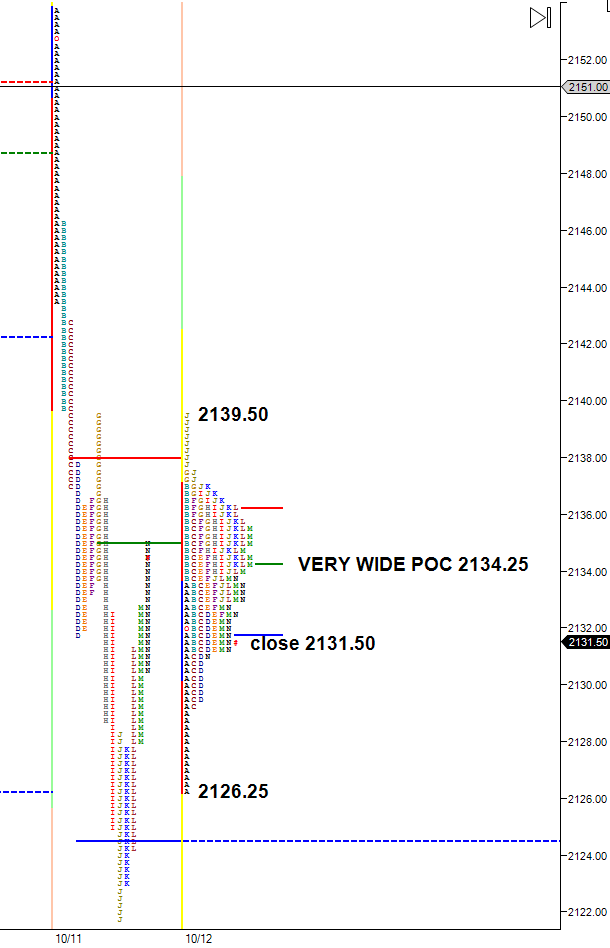
The market traded in a balance Wednesday, rotating around the prior close and point of control/late rally high, and failed to trade below the previous session low or above the previous session G period high at 2139.50.
Wednesday is an inside day, with a very wide point of control at 2134.25.
If the pit session open is within Wednesday’s range on Thursday, a breakout from either end of Wednesday’s range should have better odds of continuation if price first trades to or near the wide point of control at 2134.25.
References above Wednesday’s high include the single print at 2143.25, and Tuesday’s excess A period single prints.
The immediate references below Wednesday’s low is Tuesday’s low at 2121.75, acceptance below that level could see price repair the near matching daily lows at 2112.00/2111.75 from September 13/14.
Often in the case of a gap opening away from a session with a prominent point of control, the more prominent the POC is, the better the odds are of price revisiting it in a future trading session. The market can get too long, or too short, away from the “fairest price”.
This doesn’t have to happen the next trading session. If the market gaps open higher or lower, what is the context of the gap? Large gaps are seldom filled the next trading session.

Subscribe: