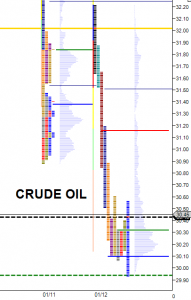
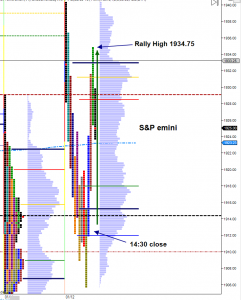
Yet another emotionally driven selloff in the ES Tuesday, with the S&P emini chart almost mirroring the crude futures. After a gap up opening, closing the gap, then climbing up to and through its overnight high by 3 points, the ES then again followed crude’s lead lower and plummeting down app. 35 points from the high. But as soon as the crude oil pit session closed the ES miraculously staged a 28 point short covering rally, and finally closed the session higher on the day at 1924.75. A reference for Wednesday is the rally high at 1934.75.
|
|
The ES has stopped one time-framing down on the daily chart since the second trading day of the year. Is it just so inventory can rebalance and continue the intermediate downward trend, or is a reversal coming?
ShareSubscribe: