
ES low confidence regular hour trading session although POC and value was higher.
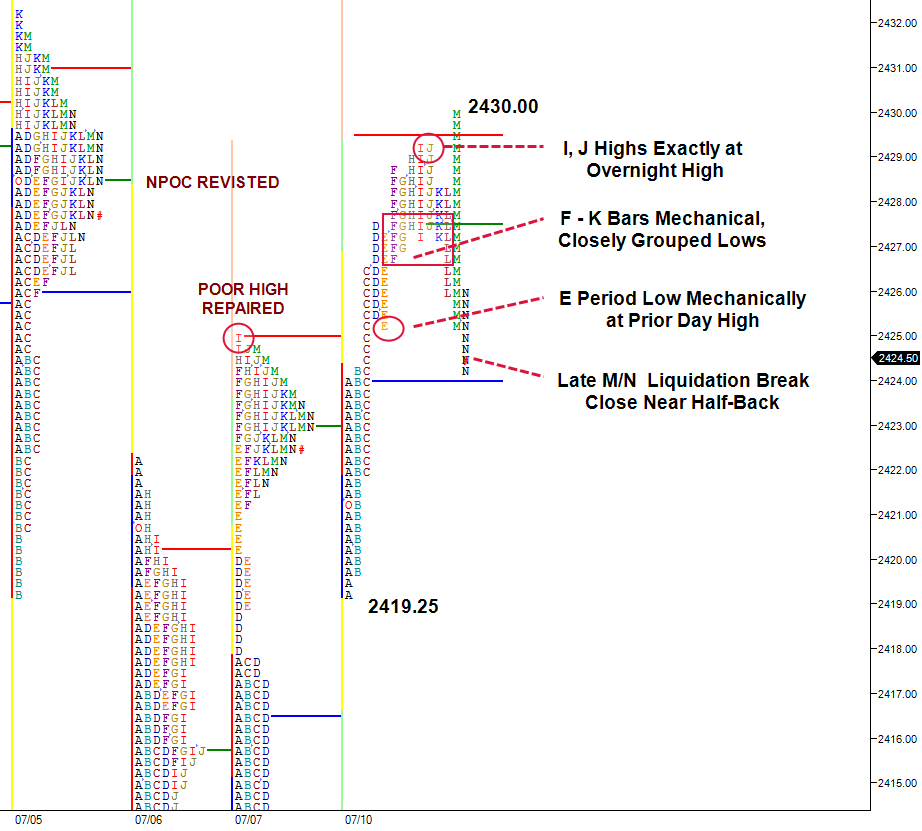
Apparent short term traders getting too long, buying near lows of prior thirty minute bars F through K periods. Late liquidation break after taking out the overnight high in M period.
Notable market profile references that carry forward from Friday’s recap here.
Subscribe: