Excess?
Friday, July 14th’s late rally to the S&P 500 emini’s latest all time high created excess on all time frames. The question is, does it hold?
ES Daily Chart:
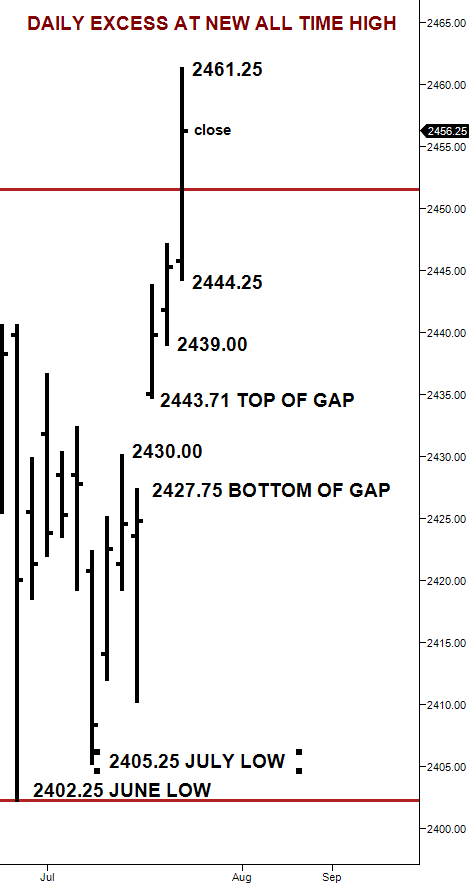
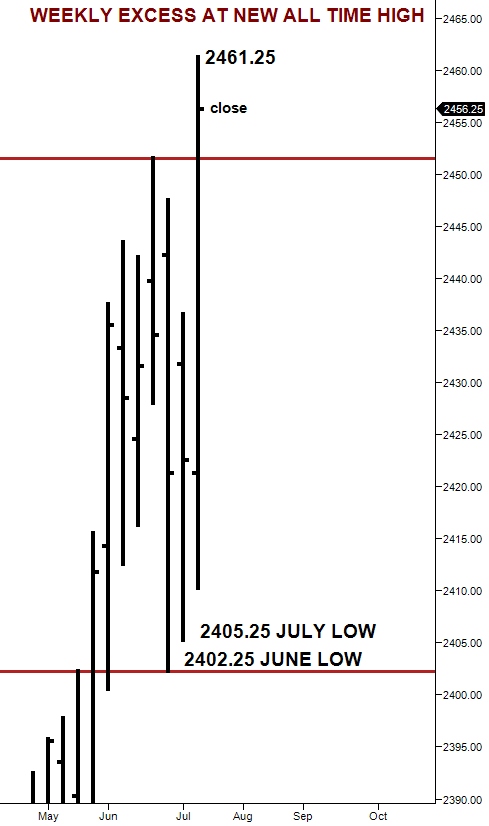
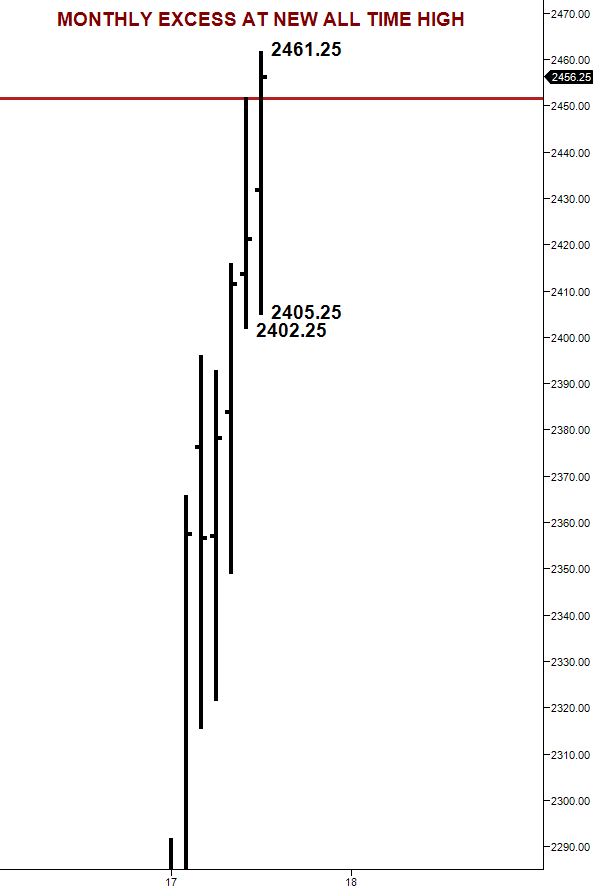
For weeks there has been a lack of excess, or no completion, to the upside of the market. Friday’s rally created substantial excess at the high on the daily, weekly and monthly chart:
ES Weekly Chart:
ES Monthly Chart:
The first question to ask is, prior to Monday’s open, was a new all time Globex high made Sunday night or early Monday morning in the overnight/pre-market session? Although they can be lasting for quite some time, there are high odds that the market will revisit any new all time high that is made in an overnight session.
If a new all time high is not made in the Globex session, where does price open Monday morning in relation to Friday’s range?
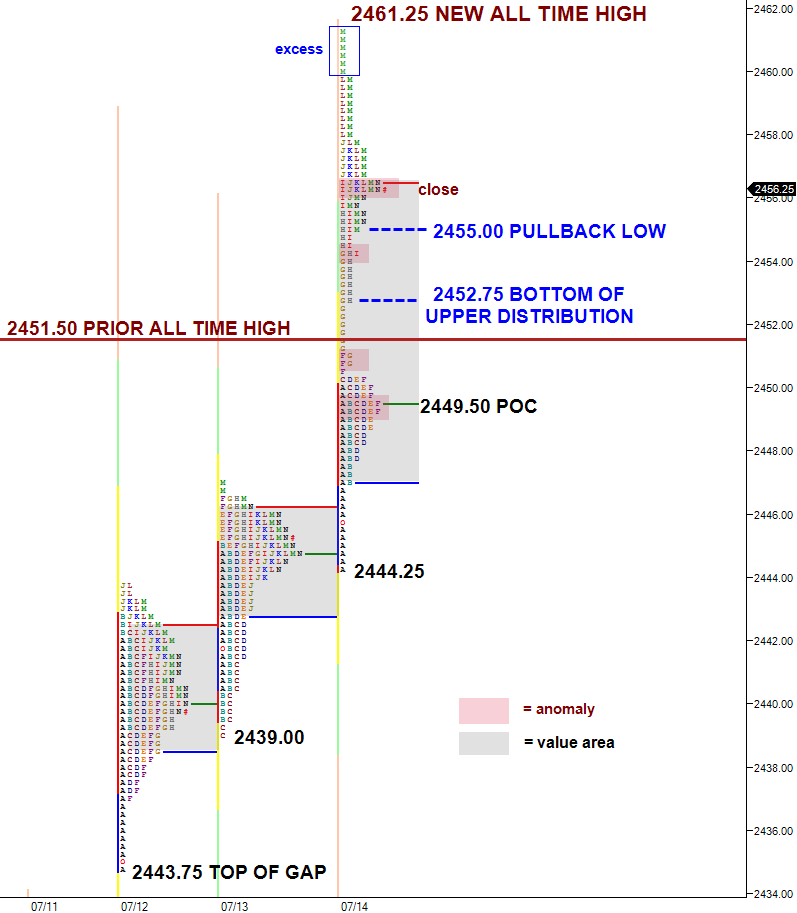
Trading above Friday’s late pullback low at 2455.00 could keep the current uptrend in tact, and acceptance above Friday’s close challenges the daily excess and potentially the all new time high at 2461.25.
Failure for price to hold 2455.00 probably easily tests the upper distribution low at 2452.75, and the prior all time high at 2451.50. If the market is strong, the prior all time high should be support.
Trading below 2451.50 should easily repair the anomalies at 2451.00 and 2449.50 (POC), acceptance below 2451.50 and back into Friday’s lower distribution potentially targets the low at 2444.25.
A potential sign that Friday’s excess at the all time high could turn into long term, lasting excess (barring a new Globex session high) would be seeing clear price acceptance and lower developing value back below the prior all time high, trading below Friday’s low, testing Thursday’s low at 2439.00, and attempt to fill the gap from July 7th at 2430.00. This doesn’t have to happen in one day.
Balance rules could apply regarding all distributions/ balance areas:
– Look above/below a balance and accelerate
– Look above or below and fail
– Remain in balance
(the above, post and all posts on es-traders.com, is an interpretation of market generated information using the Market Profile, and the information contained within is to be used for informational purposes only and not to be construed as investment or trading advice. DO NOT BASE ANY INVESTMENT DECISION UPON ANY MATERIALS FOUND ON THIS WEBSITE. We are not registered as a securities broker-dealer or an investment adviser either with the U.S. Securities and Exchange Commission (the “SEC”) or with any state securities regulatory authority. We are neither licensed nor qualified to provide investment advice. Please read our disclaimer)

Subscribe: