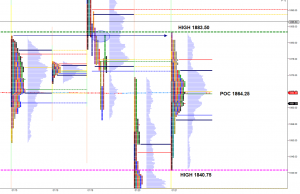
MONDAY JANUARY 11, 2016 S&P MARKET PROFILE RECAP

January11 2016 Market Profile Structure

The market rallied to just two ticks past the overnight high in the first period Monday, then sold off to just two ticks above Friday’s close. The third period saw price climb to exactly at the base of Friday’s late day spike, then sold off abruptly over 15 points, taking out the low.

After another short lived “rally” to just above half-back in the fifth 30 minute period, the ES continued to follow the selloff in crude oil, one time-framing down through the overnight low.

Volatility was high again on Tuesday, as price then rallied again 16+ points but could not get a foothold back into Friday’s range until the final 30 minute period when the buying ledge – 3 wide TPO’s – was taken out at 1910.25 and the shorts were squeezed.

“Cat’s away Mice will play”. With no clear evidence of longer time frame players in sight it appears the S&P emini market is still dominated by day and shorter term traders using almost exact reference points pushing it at their will. Can they drive prices low enough to trigger longer term money, or will they be squeezed more? Time will tell.

Focusing Tuesday on Monday’s wide POC at 1909 for acceptance/rejection, and also at the late afternoon rally high at 1922.75. The base of Monday’s spike also still appears to be in play. If overnight trade Monday can stay above the regular session close at 1914.25 further short squeezing might occur on Tuesday if they can’t trade below it.

Share  Facebooktwitterredditpinterestlinkedinmail


Subscribe: 

Youll never look at the markets the same way again