The ES opened at 2330.75 on the Monday after the Easter Weekend Holiday, above the base of the late day spike from Friday’s Market Profile chart at 2329.50. Briefly trading below that level in the opening period, there was no price acceptance back into the spike inferring the late, lower prices were being rejected.
The market rallied higher in B period, trading through Friday’s J/K period’s weak, mechanical highs exactly at Friday’s open.
Split view profile with spike, one timeframing:

Mechanical Buying
The C period pullback low traded exactly to the half back level and first period high at 2333.25, filling the A/B single print before grinding and one timeframing higher for the remainder of the session (although the K period low traded a tick below J, it did not stop the onetimeframing – two or more ticks above or below a previous bar is required to stop one timeframing).
The buying from almost exactly at the previous bar lows in most of the periods suggests this day was completely dominated by short term and day time frame traders. NYSE daily volume was also very light at just 2.81 billion shares.
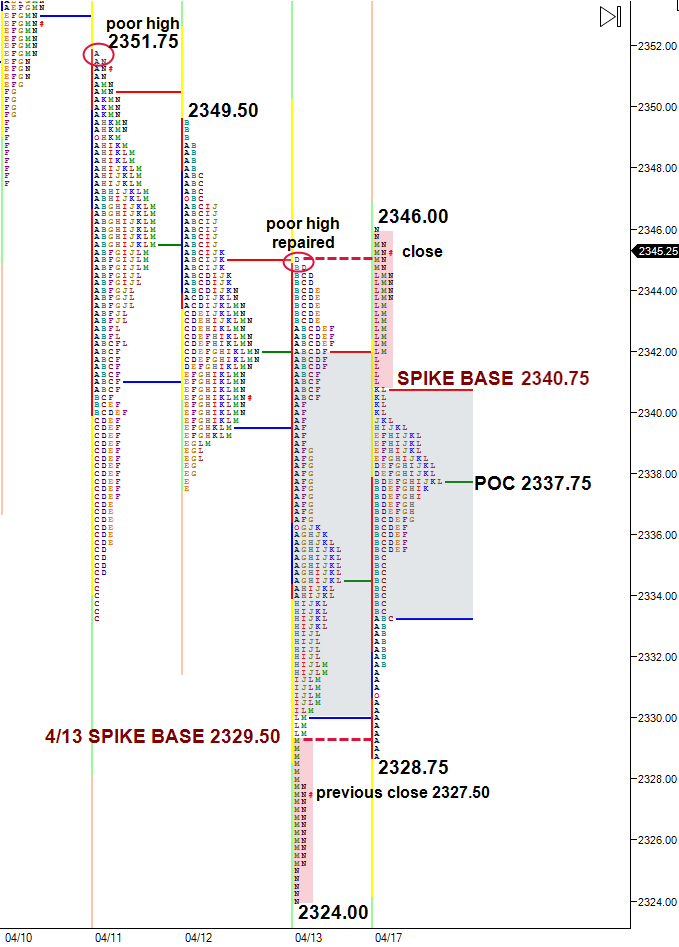
Monday’s profile left a late day spike above the K period high at 2340.75, repairing the poor high at 2345.00 from Friday.
Opening above the top of the spike and high of day at 2346.00 on Tuesday (gap opening higher) suggests acceptance of the late higher prices, and that the late day price probe did not extend high enough to cut off the buying. The auction might not be not over.
If the rally is sustained on Tuesday, potential targets above are the highs from 4/12 at 2349.50, the poor high (one TPO of excess) at 2351.75 from 4/11 and potentially the prior weekly high at 2363.25
Opening within the spike shows price acceptance, the market found a place where two sided trade could occur. The base of the spike at 2341.00 could be short term support. CAUTION – because of the very mechanical nature of Monday’s trade and light volume, the “support” might not be very strong at all, and all levels created by weaker hands are easily breached if longer timeframes enter the market.
Opening below the spike base at 2340.75, or trading with acceptance below it, shows rejection of the late day higher price probe. If price fails to find acceptance above the 10 TPO wide point of control at 2337.75, the near matching consecutive bar lows below that level could trigger the “firecracker effect“, triggering stops below. The matching selling ledge D/E/F lows at 2335.50 would then also have good odds of being tested, along with Monday’s very mechanical C period low at 2333.25.
To the downside, if selling gains momentum and the two prior daily lows fail to hold (Friday’s 2324.00 low was also the prior weekly low), the March 2318.00 low comes back into focus. Trading below 2318.00 would stop the one timeframing higher on the monthly chart and could potentially bring in longer timeframe selling.
(the above post and all posts on es-traders.com is an interpretation of market generated information using the Market Profile, and the information contained within is to be used for informational purposes only and not to be construed as investment or trading advice. Please read our disclaimer

Subscribe: